Gratis med prøveperiode Exploring the digital economy and growth through innovative computer generated network visualizations this captivating image exploring the digital economy and growth through innovative computer generated network visualizations this captivating image.
Gratis med prøveperiode Abstract data visualization charts and graphs representing complex information statistics scientific concepts diverse collection abstract data visualization charts and graphs representing complex information statistics scientific concepts diverse collection.
Gratis med prøveperiode Abstract data visualization charts and graphs representing complex information statistics scientific concepts diverse collection abstract data visualization charts and graphs representing complex information statistics scientific concepts diverse collection.
Gratis med prøveperiode Et sæt 3D-ikoner, Infografik. Statistik, Analyse og Visualisering. Cirkeldiagram. 3D-objekter på en gennemsigtig baggrund.. AI-genereret Et sæt 3D-ikoner, Infografik. Statistik, Analyse og Visualisering. Cirkeldiagram. 3D-objekter på en gennemsigtig
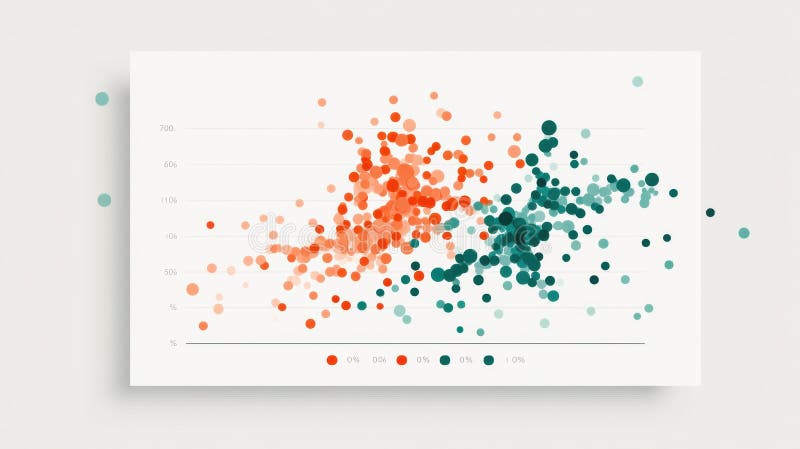
Gratis med prøveperiode Scattered with two color coded data clusters in orange and teal showing the distribution relationship scatter plot correlation on scattered with two color coded data clusters in orange and teal showing the distribution relationship scatter plot correlation on.
Gratis med prøveperiode Data science icons in silhouette vector with simple geometric shapes for analytics and information visualization clean data science icons in silhouette vector with simple geometric shapes for analytics and information visualization clean.
Gratis med prøveperiode Illustration features blue dots lines waves representing data points science conceptual image shows networks connections analysis illustration features blue dots lines waves representing data points science conceptual image shows networks connections analysis.
Gratis med prøveperiode Three dimensional visualization of abstract digital network data three dimensional visualization of abstract digital network data.
Gratis med prøveperiode Exploring the digital economy growth through innovative holographic scatter plots and economic indicators this captivating image exploring the digital economy growth through innovative holographic scatter plots and economic indicators this captivating image.
Gratis med prøveperiode Exploring the vivid intersection of digital economy growth and economic indicators through colorful clouds this captivating image exploring the vivid intersection of digital economy growth and economic indicators through colorful clouds this captivating image.
Gratis med prøveperiode Dette billede viser fire forskellige typer visuelle datarepræsentationer. Øverst til venstre ser det ud til at være et tematisk kort med farvekodede regioner, der muligvis repræsenterer arealanvendelse eller vegetationstyper. Øverst til højre ser det ud til at være et scatterplot med høj densitet eller et støjmønster, der potentielt indikerer højde eller en form for rumlig densitetsanalyse. Fire forskellige visuelle repræsentationer af segmentering af geografiske og miljømæssige data, isoleret på hvid baggrund. Dette billede viser fire forskellige typer visuelle datarepræsentationer. Øverst til venstre ser det ud til at være et tematisk kort med farvekodede regioner, der muligvis repræsenterer arealanvendelse eller vegetationstyper. Øverst til højre ser det ud til at være et scatterplot med høj densitet eller et støjmønster, der potentielt indikerer højde eller en form for rumlig densitetsanalyse.
Gratis med prøveperiode Data visualization of performance chart with clock on calendar grid scattered dots glowing circle groups people icons conceptual data visualization of performance chart with clock on calendar grid scattered dots glowing circle groups people icons conceptual.
Gratis med prøveperiode Dynamic scatter plot showing business growth trends and financial performance with fluctuating data points visualize complex this dynamic scatter plot showing business growth trends and financial performance with fluctuating data points visualize complex this.
Gratis med prøveperiode En cybercasino-grænseflade viser et neon scatter-symbol i en poleret 3D-rendering, omgivet af holografiske knapper, svævende mønter og et abstrakt spredningsdiagram. Spredningsdiagrammet er AI-genereret. En cybercasino-grænseflade viser et neon scatter-symbol i en poleret 3D-rendering, omgivet af holografiske knapper og svævende møn. En cybercasino-grænseflade viser et neon scatter-symbol i en poleret 3D-rendering, omgivet af holografiske knapper, svævende mønter og et abstrakt spredningsdiagram. Spredningsdiagrammet er AI-genereret
Gratis med prøveperiode Visualization of dynamic clustering data points in a spherical layout isolated on transparent background white the image displays visualization of dynamic clustering data points in a spherical layout isolated on transparent background white the image displays.
Gratis med prøveperiode Statistik, analyse og visualisering. Forretningsdiagrammer og -grafer. Cirkeldiagram. 3D-objekt på en gennemsigtig baggrund.. AI-genereret Statistik, analyse og visualisering. Forretningsdiagrammer og -grafer. Cirkeldiagram. 3D-objekt på en gennemsigtig baggrund
Gratis med prøveperiode Visualization of data density using heatmap grids with varying color intensities isolated on transparent background the image visualization of data density using heatmap grids with varying color intensities isolated on transparent background the image.
Gratis med prøveperiode Abstract d representation of data clusters in a multi colored cubic space isolated on transparent background white the image shows abstract d representation of data clusters in a multi colored cubic space isolated on transparent background white the image shows.
Gratis med prøveperiode A vibrant image featuring colorful bar graphs and pie charts surrounded by dynamic abstract shapes showcasing data analysis a vibrant image featuring colorful bar graphs and pie charts surrounded by dynamic abstract shapes showcasing data analysis.
Gratis med prøveperiode Movie hero journey elements infographic vertical sequence plot story characters visualization infochart with steps circles movie hero journey elements infographic vertical sequence plot story characters visualization infochart with steps circles.
Gratis med prøveperiode Set of four different data visualization graphs representing various mathematical and statistical concepts on white background set of four different data visualization graphs representing various mathematical and statistical concepts on white background.
Gratis med prøveperiode Set of four different data visualization graphs representing various mathematical and statistical concepts on white background set of four different data visualization graphs representing various mathematical and statistical concepts on white background.
Gratis med prøveperiode Colorful number and symbol graphic a modern visual representation of data analysis ideal for digital projects requiring this colorful number and symbol graphic a modern visual representation of data analysis ideal for digital projects requiring this.
Gratis med prøveperiode Curved lines a line graph blue plot points gears ideal for data analysis technology innovation progress efficiency cloud computing curved lines a line graph blue plot points gears ideal for data analysis technology innovation progress efficiency cloud computing.
Gratis med prøveperiode Dette billede viser en detaljeret abstrakt 3D-graf, der fremviser datatoppe og -dale i et levende wireframe-design, som fremhæver moderne digitale visualiseringsteknikker. Abstrakt 3D-grafisk repræsentation af komplekse data, der visualiserer toppe og dale i monokrom med et indviklet wireframe-design. Dette billede viser en detaljeret abstrakt 3D-graf, der fremviser datatoppe og -dale i et levende wireframe-design, som fremhæver moderne digitale visualiseringsteknikker
Gratis med prøveperiode Aerial view shows property mapping with glowing location markers connected lines illustrating real estate development urban aerial view shows property mapping with glowing location markers connected lines illustrating real estate development urban.
Gratis med prøveperiode Detailed d model of a solid part for engineering design and manufacturing cad mockup rendering concepts this captivating showcases detailed d model of a solid part for engineering design and manufacturing cad mockup rendering concepts this captivating showcases.
Gratis med prøveperiode Seismograph displaying vivid and precise earthquake data visualization a seismograph screen showing detailed earthquake data with seismograph displaying vivid and precise earthquake data visualization a seismograph screen showing detailed earthquake data with.
Gratis med prøveperiode Visuelle diagrammer og grafer, et sæt 3D-ikoner. Analyse, statistik, infografik og datavisualisering. Cirkeldiagram. Tredimensionelt objekt på en gennemsigtig baggrund. AI-genereret Visuelle diagrammer og grafer, et sæt 3D-ikoner. Analyse, statistik, infografik og datavisualisering. Cirkeldiagram. Tre
Gratis med prøveperiode Denne 3D-rendering viser en matematisk overfladegraf, hvor et autoencoder-neuralt netværk identificerer og fremhæver anomalier. Anomalierne, der er repræsenteret som spidser, er markeret i en levende magenta og skiller sig ud mod grafens glatte overflade. Denne visualisering er en fremragende repræsentation af, hvordan maskinlæringsmodeller kan opdage uregelmæssigheder. 3D-rendering af Anomalidetektion ved hjælp af en Autoencoder, der fremhæver Spidser på en Overfladegraf. Denne 3D-rendering viser en matematisk overfladegraf, hvor et autoencoder-neuralt netværk identificerer og fremhæver anomalier. Anomalierne, der er repræsenteret som spidser, er markeret i en levende magenta og skiller sig ud mod grafens glatte overflade. Denne visualisering er en fremragende repræsentation af, hvordan maskinlæringsmodeller kan opdage uregelmæssigheder.
Gratis med prøveperiode Denne 3D-rendering viser en matematisk overfladegraf, hvor et autoencoder-neuralt netværk identificerer og fremhæver anomalier. Anomalierne, der er repræsenteret som spidser, er markeret i en levende magenta og skiller sig ud fra grafens glatte overflade. Denne visualisering er en fremragende repræsentation af, hvordan maskinlæringsmodeller kan opdage uregelmæssigheder. 3D-rendering af Anomalidetektion ved hjælp af en Autoencoder, der fremhæver Spidser på en Overfladegraf. Denne 3D-rendering viser en matematisk overfladegraf, hvor et autoencoder-neuralt netværk identificerer og fremhæver anomalier. Anomalierne, der er repræsenteret som spidser, er markeret i en levende magenta og skiller sig ud fra grafens glatte overflade. Denne visualisering er en fremragende repræsentation af, hvordan maskinlæringsmodeller kan opdage uregelmæssigheder.
Gratis med prøveperiode Sales graphs data illustration relationship increase graph plot mapping analysis sales graphs data sales graphs data sales graphs data illustration relationship increase graph plot mapping analysis sales graphs data sales graphs data.
Gratis med prøveperiode Bubble chart with axis d line object scattered plot infographic business metrics analytics graph data visualization isolated bubble chart with axis d line object scattered plot infographic business metrics analytics graph data visualization isolated.
Gratis med prøveperiode Illustration af sammenligning og visualisering af afdelingsdata grafer, målinger og indsigt, linjer farver, afdelingsdata grafer genereret af AI Afdelingsdata grafer
Gratis med prøveperiode Period oscillating graph illustration waveform cycle harmonic oscillation plot signal period oscillating graph illustration waveform cycle harmonic oscillation plot signal.
Gratis med prøveperiode Data layered line chart in art style illustration visualization graph trend analytics mimal data layered line chart in art style illustration visualization graph trend analytics mimal.
Gratis med prøveperiode Illustration af graf over tab ved modelsynkronisering, træningsvisualisering, nøjagtighedsmetrikker, præstationstendens, graf over tab ved modelsynkronisering AI-genereret Graf over tab ved modelsynkronisering
Gratis med prøveperiode Analytics elevating graph illustration visualization data insights metrics progress statistics analytics elevating graph illustration visualization data insights metrics progress statistics.
Gratis med prøveperiode Ai generated linear graph this image shows a simple by featuring red line ascending across gridded background it s clean ai generated linear graph this image shows a simple by featuring red line ascending across gridded background it s clean.
Gratis med prøveperiode Animation morphing line graph illustration transition dynamic visualization data smooth transformation animation morphing line graph illustration transition dynamic visualization data smooth transformation.
Gratis med prøveperiode Interactive scrolling line chart illustration dynamic axis plot graph series time interactive scrolling line chart illustration dynamic axis plot graph series time.
Gratis med prøveperiode Bubble chart with axis indicators d cartoon object scattered plot infographic business metrics analytics graph data visualization bubble chart with axis indicators d cartoon object scattered plot infographic business metrics analytics graph data visualization.
Gratis med prøveperiode Explore a cybernetic world with stunning d landscapes and abstract grids showcasing the essence of big data visualization immerse explore a cybernetic world with stunning d landscapes and abstract grids showcasing the essence of big data visualization immerse.
Gratis med prøveperiode Graph emitting line chart illustration visual plot emission trend metric axis graph emitting line chart illustration visual plot emission trend metric axis.
Gratis med prøveperiode Red infographic elements collection of including charts graphs diagrams and icons perfect for presentations reports data red infographic elements collection of including charts graphs diagrams and icons perfect for presentations reports data.
Gratis med prøveperiode Bitcoin cryptocurrency stock market data chart graph on exchange motion visualization of volatility process bitcoin cryptocurrency stock market data chart graph on exchange motion visualization of volatility process.
Gratis med prøveperiode Bitcoin cryptocurrency stock market data chart graph on exchange motion visualization of volatility process bitcoin cryptocurrency stock market data chart graph on exchange motion visualization of volatility process.
Gratis med prøveperiode A sleek flat icon featuring purple gradient against bold black background perfect for data visualization themes vibrant combined a sleek flat icon featuring purple gradient against bold black background perfect for data visualization themes vibrant combined.
Gratis med prøveperiode Billedet viser en simpel linjetegning af en graf med en buet linje og tre punkter forbundet med linjer, der ligner et diagram eller en graf. En stor pil kommer ud fra højre side af cirklen og peger opad og til højre, hvilket indikerer vækst eller stigning. Baggrunden på billedet er simpel hvid, hvilket giver en ren og minimalistisk æstetik. En sort-hvid graf med en pil, der peger opad. Billedet viser en simpel linjetegning af en graf med en buet linje og tre punkter forbundet med linjer, der ligner et diagram eller en graf. En stor pil kommer ud fra højre side af cirklen og peger opad og til højre, hvilket indikerer vækst eller stigning. Baggrunden på billedet er simpel hvid, hvilket giver en ren og minimalistisk æstetik.
Gratis med prøveperiode Explore the power of data visualization to simplify and amplify complex information insights for better decisionmaking transform explore the power of data visualization to simplify and amplify complex information insights for better decisionmaking transform.
Gratis med prøveperiode Explore the power of data visualization to simplify and amplify complex information insights for better decisionmaking transform explore the power of data visualization to simplify and amplify complex information insights for better decisionmaking transform.
Gratis med prøveperiode Orange curve graph in dark setting an is presented on a background with blue neon lights indicating data trends for business orange curve graph in dark setting an is presented on a background with blue neon lights indicating data trends for business.
Gratis med prøveperiode Abstract business data visualization this image features a clean minimalist composition of various visualizations bar graphs pie abstract business data visualization this image features a clean minimalist composition of various visualizations bar graphs pie.
Gratis med prøveperiode Isometric business data visualization view of various charts and graphs on a white background the image features pie chart bar isometric business data visualization view of various charts and graphs on a white background the image features pie chart bar.
Gratis med prøveperiode Network plotting with d rendering and big data visualization network plotting with d rendering and big data visualization.
Gratis med prøveperiode Modern infographic design showcasing various data visualizations d pie charts bar graphs and scatter plots are presented on modern infographic design showcasing various data visualizations d pie charts bar graphs and scatter plots are presented on.
Gratis med prøveperiode En stor tom reklamesøjle står på en græsbeklædt grund med buske og træer. Klar himmel og fjerne bygninger fremkalder urban ro, reklamepotentiale og visuel klarhed. En stor tom reklamesøjle står på en græsbeklædt grund med buske og træer.
Gratis med prøveperiode D surface plot alongside a line graph illustrating data analysis trends ideal for analytics statistics presentations forecasting d surface plot alongside a line graph illustrating data analysis trends ideal for analytics statistics presentations forecasting.
Gratis med prøveperiode A vibrant growth chart showcasing data trends blending pastel neon hues with abstract light effects for impactful visuals a vibrant growth chart showcasing data trends blending pastel neon hues with abstract light effects for impactful visuals.
Gratis med prøveperiode Infographic visualization engaging in analytical activity image of various elements such as charts graphs and data visualizations infographic visualization engaging in analytical activity image of various elements such as charts graphs and data visualizations.
Gratis med prøveperiode Visual representation of a complex mathematical concept illustrated through d graph abstract visualization and multidimensional royalty-free illustration visual representation of a complex mathematical concept illustrated through d graph abstract visualization and multidimensional
Gratis med prøveperiode A vibrant growth chart showcasing data trends blending pastel neon hues with abstract light effects for impactful visuals a vibrant growth chart showcasing data trends blending pastel neon hues with abstract light effects for impactful visuals.
Gratis med prøveperiode A vibrant growth chart showcasing data trends blending pastel neon hues with abstract light effects for impactful visuals a vibrant growth chart showcasing data trends blending pastel neon hues with abstract light effects for impactful visuals.
Gratis med prøveperiode Statistical data visualization trend analysis of sareorplojicam and s snpavai over time area chart illustrating trends in across statistical data visualization trend analysis of sareorplojicam and s snpavai over time area chart illustrating trends in across.
Gratis med prøveperiode Data, analyse, visualisering, graf, notesbog, telefon, kontor. Mandens hænder skriver på en bærbar computer ved et skrivebord derhjemme, med en smartphone og et grafisk overlay. Data, analyse, visualisering, graf, notesbog, telefon, kontor
Gratis med prøveperiode Panel der viser kodeblokke, pseudokode, VARIABEL-bjælke og ALGORITME-bølgeform på en mørk gradient. Futuristisk, teknologi, datavisualisering, interface, cyber, digital, analyse Panel der viser kodeblokke, pseudokode, VARIABEL-bjælke og ALGORITME-bølgeform på en mørk gradient
Gratis med prøveperiode Displaying teal dot and bar series on digital dashboard with numeric labels grid lines data visualization analytics interface stockillustration displaying teal dot and bar series on digital dashboard with numeric labels grid lines data visualization analytics interface
Gratis med prøveperiode Floral growth chart with artistic branch plot points vector design generative ai an illustration combining a graceful subtle stockillustration floral growth chart with artistic branch plot points vector design generative ai an illustration combining a graceful subtle
Gratis med prøveperiode Displaying holographic financial dashboard in dark d space with bar charts and line graphs futuristic immersive analytics virtual royalty-free illustration displaying holographic financial dashboard in dark d space with bar charts and line graphs futuristic immersive analytics virtual
Gratis med prøveperiode Graf med Sinusbølge skærer akse ved siden af Binær Kode viser en sinusbølgegraf, der skærer aksen, ledsaget af binær kode, der symboliserer dataanalyse. Sinusbølgegraf, der skærer aksen - Visualisering. Graf med Sinusbølge skærer akse ved siden af Binær Kode viser en sinusbølgegraf, der skærer aksen, ledsaget af binær kode, der symboliserer dataanalyse.
Gratis med prøveperiode Graf med Sinusbølge skærer akse ved siden af Binær Kode viser en sinusbølgegraf, der skærer aksen, ledsaget af binær kode, der symboliserer dataanalyse. Sinusbølgegraf, der skærer aksen - Visualisering. Graf med Sinusbølge skærer akse ved siden af Binær Kode viser en sinusbølgegraf, der skærer aksen, ledsaget af binær kode, der symboliserer dataanalyse.
Gratis med prøveperiode Graf med Sinusbølge skærer akse ved siden af Binær Kode viser en sinusbølgegraf, der skærer aksen, ledsaget af binær kode, der symboliserer dataanalyse. Sinusbølgegraf, der skærer aksen Visualisering. Graf med Sinusbølge skærer akse ved siden af Binær Kode viser en sinusbølgegraf, der skærer aksen, ledsaget af binær kode, der symboliserer dataanalyse.
Gratis med prøveperiode Graf med Sinusbølge skærer akse ved siden af Binær Kode viser en sinusbølgegraf, der skærer aksen, ledsaget af binær kode, der symboliserer dataanalyse. Sinusbølgegraf, der skærer aksen - Visualisering. Graf med Sinusbølge skærer akse ved siden af Binær Kode viser en sinusbølgegraf, der skærer aksen, ledsaget af binær kode, der symboliserer dataanalyse.
Gratis med prøveperiode Udforsk indsigtsfuld dataanalyse med forskellige diagrammer og grafer, der viser finansiel præstation, markedstendenser og strategiske forretningsindsigter for informerede beslutninger og vækst. Moderne forretningsanalyse og datavisualiseringsdiagrammer til finansiel vækst og strategi. Udforsk indsigtsfuld dataanalyse med forskellige diagrammer og grafer, der viser finansiel præstation, markedstendenser og strategiske forretningsindsigter for informerede beslutninger og vækst.
Gratis med prøveperiode Viser en graf med candlestick bars, linjediagrammer og procentmarkører i handelsgrænsefladen. Finans, handel, analyse, investering, teknologi, datavisualisering, markedstendenser Viser en graf med candlestick bars, linjediagrammer og procentmarkører i handelsgrænsefladen
Gratis med prøveperiode Extending three dimensional bar chart across control room desk with line plots and gauge dials futuristic digital visualization royalty-free illustration extending three dimensional bar chart across control room desk with line plots and gauge dials futuristic digital visualization
Gratis med prøveperiode Visualizing light blue d lattice twisting through interface with hex grids gauges code blocks futuristic data visualization vectorillustration visualizing light blue d lattice twisting through interface with hex grids gauges code blocks futuristic data visualization
Gratis med prøveperiode Displaying rectangular digital panels clustering in dashboard with numeric displays and charts technology data visualization royalty-free illustration displaying rectangular digital panels clustering in dashboard with numeric displays and charts technology data visualization
Gratis med prøveperiode Visualizing dashboard showing world map and line graph over grid with numeric readouts tickers technology analytics data visualizing dashboard showing world map and line graph over grid with numeric readouts tickers technology analytics data.
Gratis med prøveperiode Viser et futuristisk data dashboard med et verdenskort, hvid linjegraf og orange partikler. Futuristisk, analyse, teknologi, visualisering, digital, interface, innovation Viser et futuristisk data dashboard med et verdenskort, hvid linjegraf og orange partikler
 Log ind